
Under-Insurance Risk Index

Millions of car accidents happen in the US every year. The risk of having one depends on where you drive, and so does the financial risk that may come after.
Many drivers assume that meeting their state’s minimum insurance requirements means they’re financially protected. But state-minimum coverage often falls well short of the exposure created by a serious crash, leaving many drivers underinsured without knowing it.
We gathered data and built a state-by-state index, measuring the risk of driving without thorough insurance coverage, regardless of statutory minimums. The index combines crash rates per registered driver, the prevalence of uninsured drivers, the extent of state insurance minimums, average motor tort costs per injury crash, and the likelihood and scale of extreme motor-vehicle verdicts. Then, we combined them all into an Under-Insurance Risk Index to find out where driving with inadequate coverage puts drivers at the most risk of serious financial harm.
Download the Under-Insurance Risk Index report (PDF).
Overall Ranking
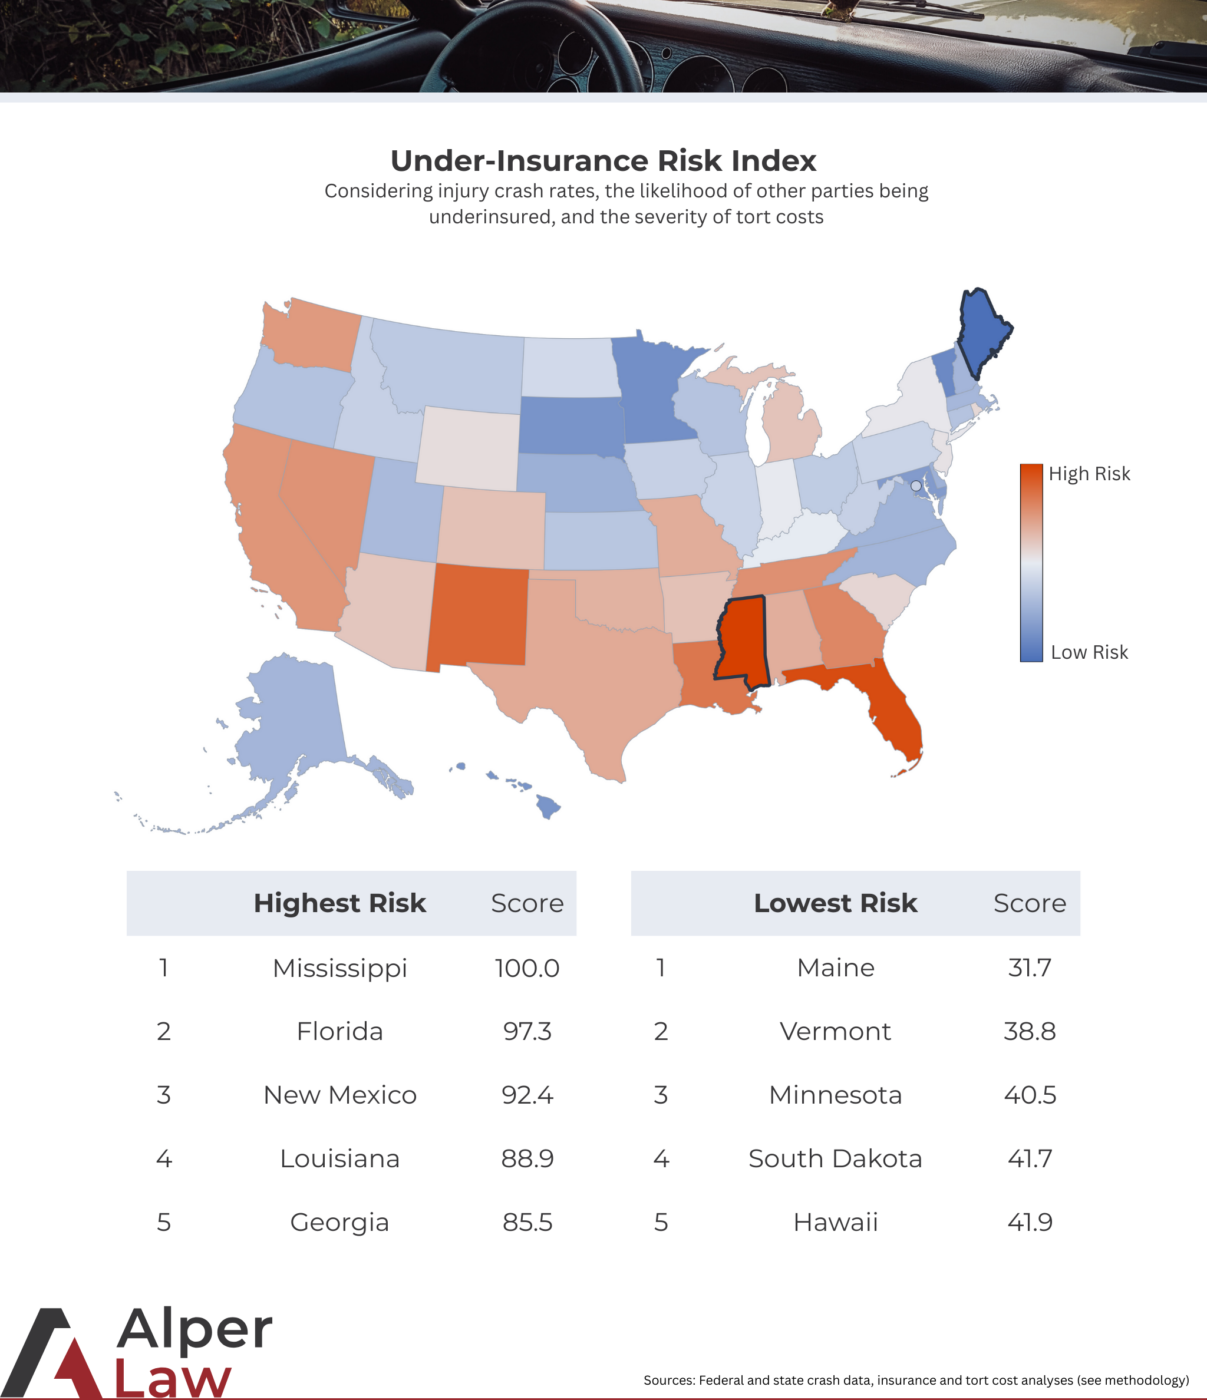
(See the data in full below)
Mississippi is the riskiest state to drive in without thorough insurance coverage, according to our index. It scored worst out of all states on both crash rates and insurance coverage, placing it in the top spot over Florida despite its comparatively low financial risk after a crash.
Florida ranks a close second. It scores poorly across the board, particularly in insurance coverage, for an overall risk index of 97.3.
At the other end of the scale, Maine is the state where drivers face the lowest overall risk. Minimum insurance requirements are among the highest in the US, uninsured driver rates are among the lowest, and despite this strong coverage environment, the state scored fourth lowest in financial risk after a crash occurs.
Geographically, the data suggests that higher-risk states are concentrated largely in the southern half of the country, while lower-risk states tend to cluster in the north. Every metric contributes somewhat to this pattern, but differences in state crash rates seem to be the main cause.
Dangerous Crashes per Registered Driver
Across the United States, an estimated 1.8 million motor vehicle crashes cause injury each year. However, a state with more accidents does not necessarily have less safe drivers. To account for differences in population and measure relative safety more accurately, we compared the number of crashes with the number of registered drivers in each state.
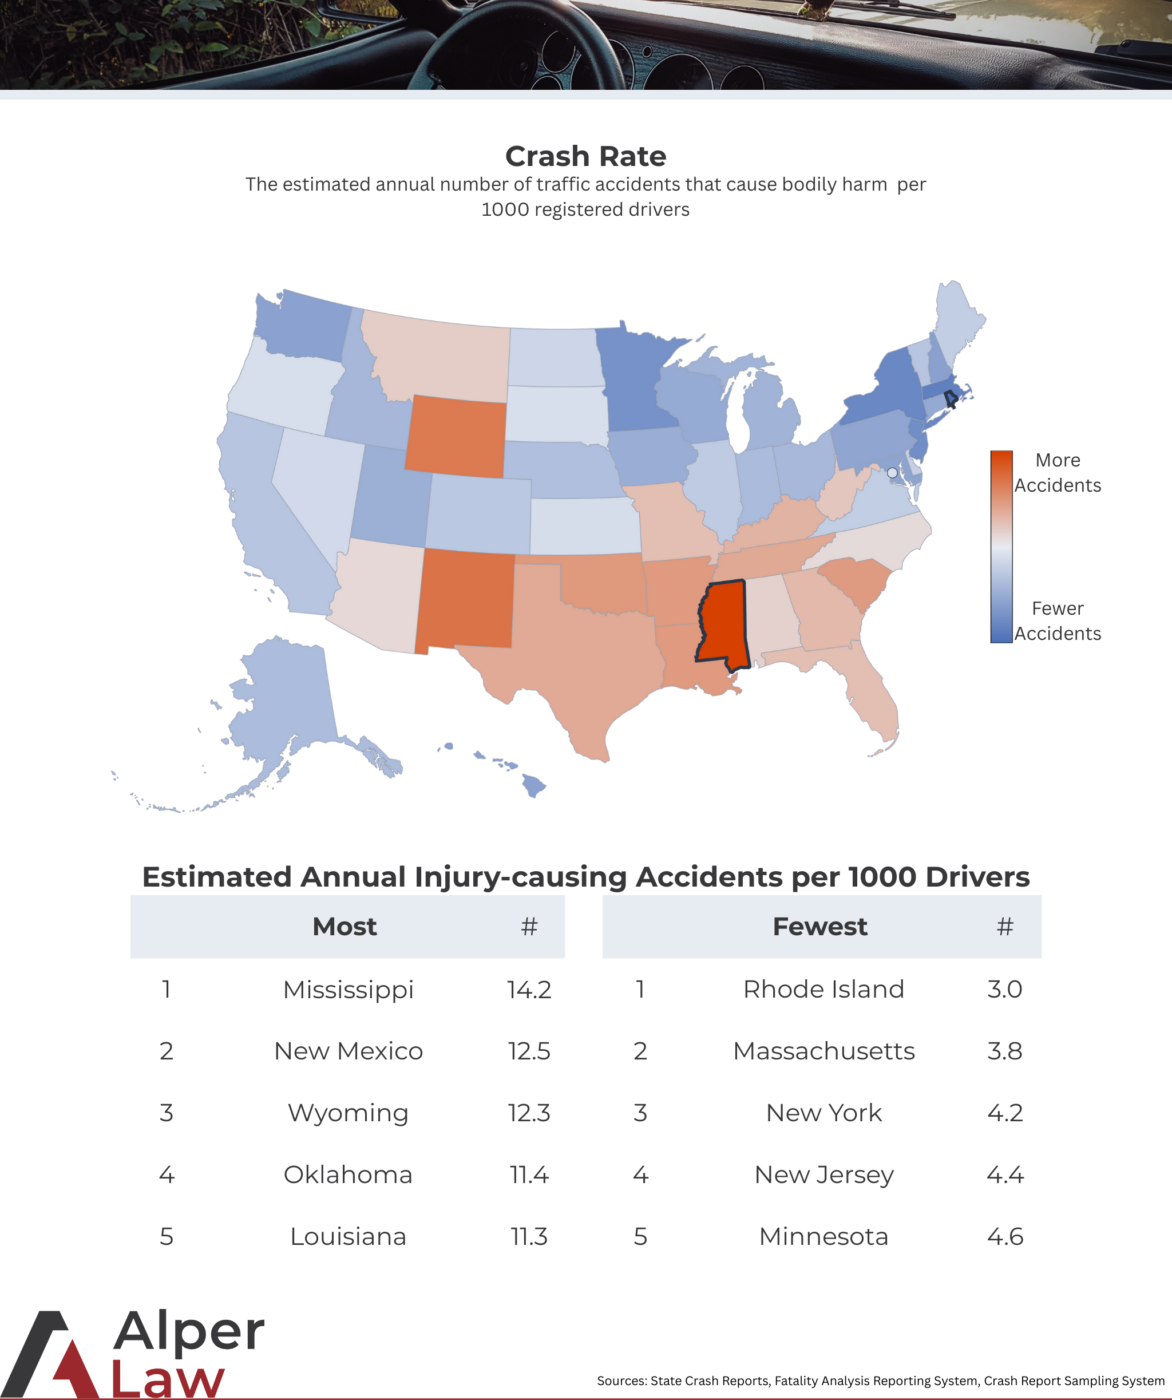
Nationally, the 1.8 million annual injury-causing accidents, spread across roughly 235 million registered drivers, come to an average of 7.8 injury-causing crashes per 1,000 drivers each year.
In Mississippi, however, the rate is almost twice as high, at 14.2 injury-causing crashes per 1,000 drivers annually. That rate is the highest of any state and makes Mississippi the most dangerous place to drive in the USA.
At the other end of the scale, Rhode Island records the fewest serious crashes per driver, at less than half the national average rate.
Once an accident has occurred, the next factor in the financial exposure of those involved is insurance coverage.
Insufficient Insurance
Almost every state requires drivers to purchase car insurance, though the level of coverage required varies from state to state. Even so, approximately 13% of people on the road in the USA are uninsured. Those who are insured up to their state’s minimum requirements are still likely underinsured for a serious accident. For example, across the 50 states and Washington, DC, only 20 jurisdictions require insurance against uninsured motorists, despite them accounting for more than 1 in 10 drivers nationally.
We compared uninsured driver rates and motor insurance minimums by state to find how vulnerable drivers are to being underinsured or being involved in an accident with someone who is underinsured.
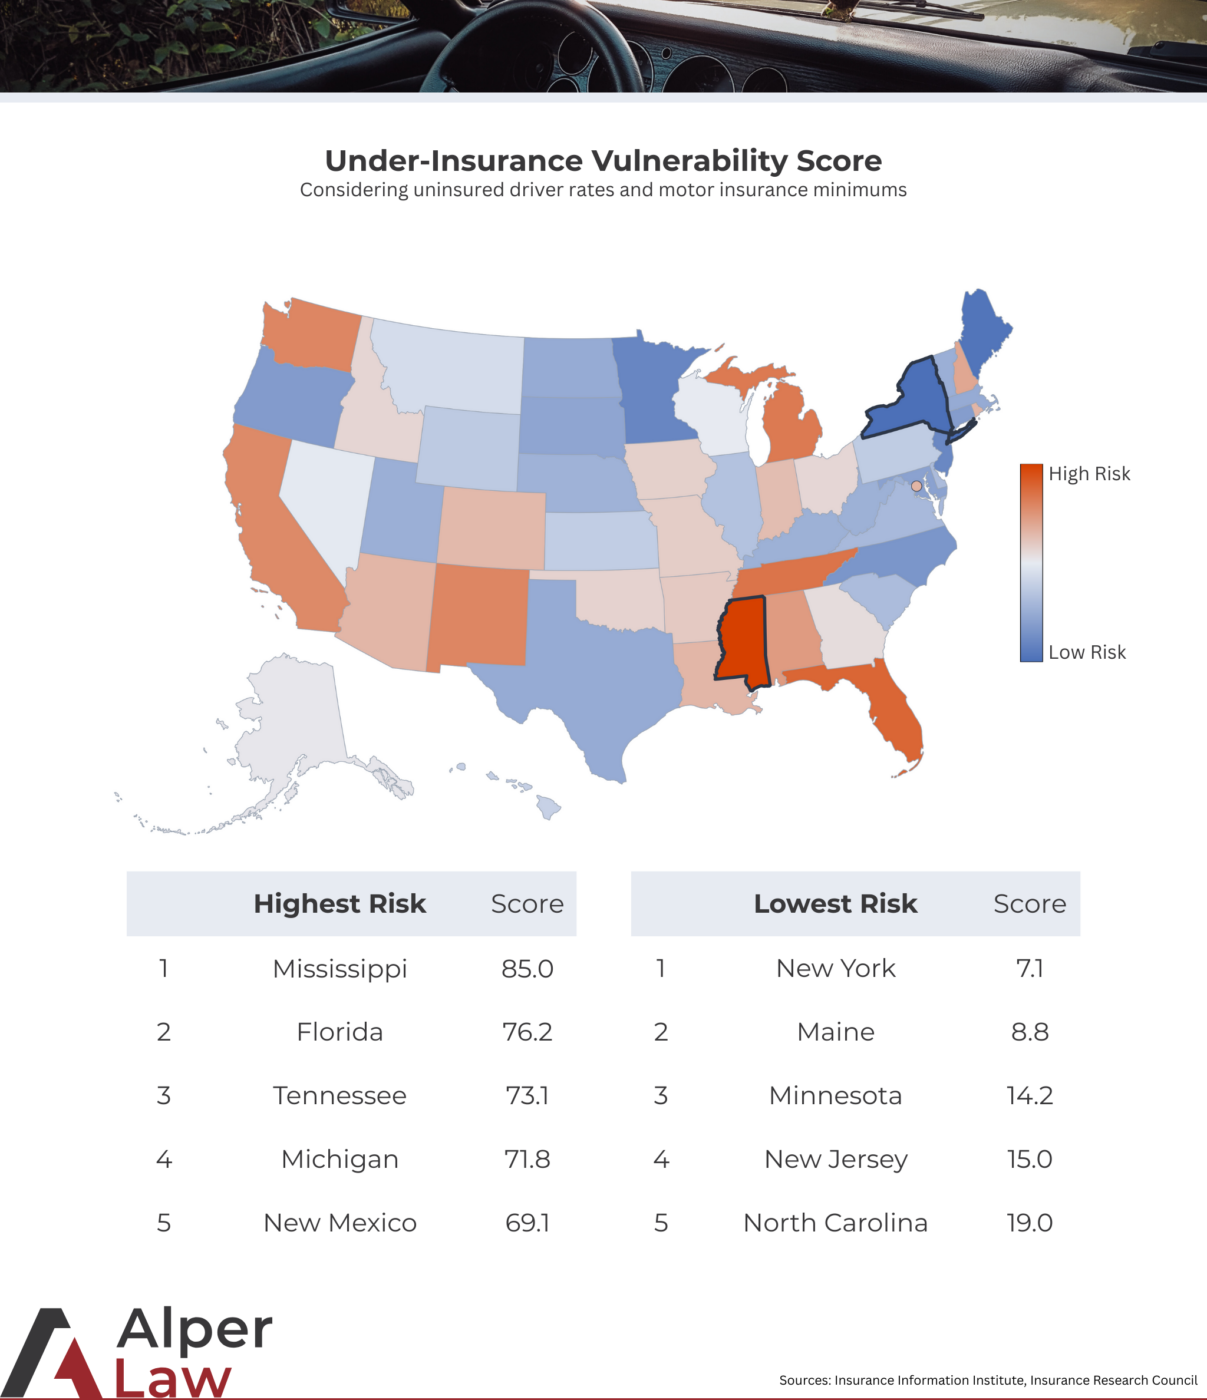
Mississippi has the highest rate of uninsured drivers in the US at 29%, and yet the state is not among the 20 that require drivers to protect themselves from accidents with an uninsured driver. The state requires $25,000 in bodily injury liability coverage per person, or $50,000 per accident, which is somewhat typical compared to other states but can easily prove insufficient in cases involving serious injury.
New York is the best-insured state, with the third-lowest rate of uninsured drivers at 4% and much wider minimum insurance requirements. It matches Mississippi on required bodily injury liability coverage, but also requires protection against uninsured and underinsured drivers, as well as personal injury protection, which pays out on any injury regardless of fault.
Financial Risk
Beyond accident rates and insurance coverage, differences in culture and in state legal systems also lead to varying levels of financial exposure after a crash has occurred. By analyzing tort costs and notable verdict sizes, we can compare this exposure.
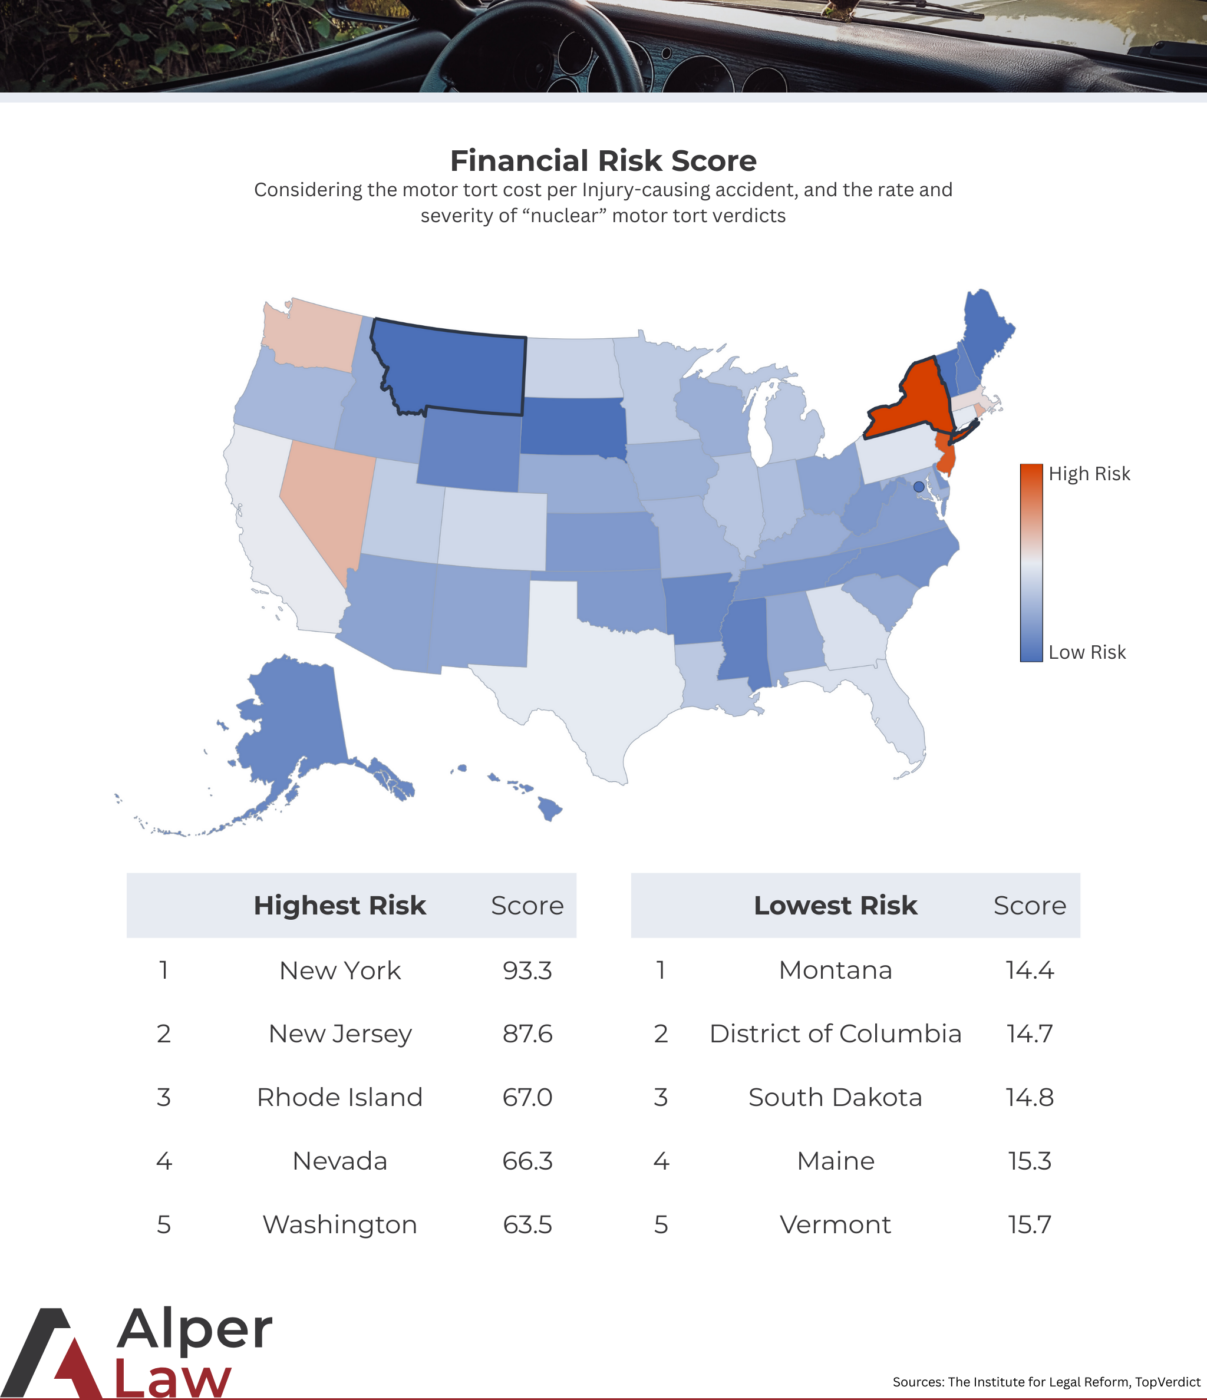
New York and New Jersey have the highest financial risk scores by a wide margin, which may explain the lower uninsured driver rates and higher insurance minimums in the 2 states.
New York, in particular, has the highest financial risk. Despite accounting for just 2.7% of injury-causing motor crashes nationwide, the state has been home to 11% of the largest motor vehicle accident verdicts in recent years.
In 2022, total motor tort costs in New York reached $12.9 billion. This equates to an average tort cost of about $238,000 per injury-causing accident, the highest figure in the country.
By comparison, the 5 lowest-risk states all have average tort costs per injury-causing accident in the $40,000-$47,000 range and have not produced any of the largest motor accident verdicts in recent years.
Mississippi, our most risk-prone state, scores well on this metric, placing nineteenth-lowest in financial risk. It has one of the lowest average tort costs per injury-causing crash at $59,000, but drivers there are not immune to financial risk. In 2019, the state was home to two motor-vehicle accident verdicts of $3.5 million and $4.2 million.
Conclusion
Driving risk in the United States is not evenly distributed, nor are the financial risks drivers face if an accident occurs. From one state to another, the likelihood of a crash can be several times higher, and the potential financial consequences can vary widely.
By combining these factors into a single index, this analysis shows where insurance requirements, crash risk, and financial exposure fail to align. In higher-risk states, meeting minimum insurance standards does not necessarily mean being adequately protected. Serious accidents there can quickly exceed policy limits, particularly when uninsured or underinsured drivers are involved.
Full Data
| State | Crashes/1k Drivers | Uninsured % | Tort Cost/Crash | Financial Risk | Vulnerability | Final Score |
|---|---|---|---|---|---|---|
| Mississippi | 14.2 | 29.40% | $58,732.77 | 20.1 | 85.0 | 100.0 |
| Florida | 10.1 | 20.40% | $137,006.80 | 50.2 | 76.2 | 97.3 |
| New Mexico | 12.5 | 21.80% | $66,395.31 | 31.4 | 69.1 | 92.4 |
| Louisiana | 11.3 | 11.70% | $111,241.10 | 42.4 | 58.0 | 88.9 |
| Georgia | 10.3 | 12.40% | $130,136.17 | 50.2 | 49.4 | 85.5 |
| Tennessee | 9.5 | 20.10% | $73,966.52 | 24.1 | 73.1 | 85.3 |
| Michigan | 5.8 | 19.60% | $85,264.48 | 34.0 | 71.8 | 77.7 |
| South Carolina | 10.5 | 10.90% | $113,101.44 | 38.2 | 46.5 | 76.9 |
| Oklahoma | 11.4 | 16.30% | $58,359.71 | 24.3 | 55.9 | 76.5 |
| Alabama | 9.5 | 19.50% | $63,640.73 | 20.4 | 61.9 | 75.9 |
| Kentucky | 9.5 | 13.90% | $78,589.65 | 27.1 | 51.8 | 72.4 |
| Nevada | 6.6 | 10.40% | $170,067.89 | 66.3 | 38.6 | 71.2 |
| Arkansas | 9.6 | 10.30% | $72,895.83 | 21.8 | 47.2 | 68.9 |
| Texas | 8.3 | 12.00% | $89,481.98 | 33.5 | 41.9 | 68.6 |
| Arizona | 7.5 | 11.80% | $104,675.24 | 37.3 | 41.7 | 68.4 |
| Missouri | 8.9 | 13.90% | $66,687.97 | 22.1 | 44.7 | 67.8 |
| New York | 4.2 | 4.10% | $237,580.46 | 93.3 | 7.1 | 65.8 |
| New Jersey | 4.4 | 3.10% | $222,237.91 | 87.6 | 15.0 | 65.6 |
| Maryland | 7.4 | 14.10% | $67,807.56 | 23.3 | 44.9 | 63.1 |
| Delaware | 8.4 | 11.40% | $74,765.17 | 25.4 | 39.1 | 62.8 |
| California | 7.1 | 16.60% | $61,280.40 | 21.3 | 47.3 | 62.4 |
| North Carolina | 8.8 | 7.40% | $75,727.60 | 24.5 | 19.0 | 60.8 |
| Colorado | 6.6 | 16.30% | $61,819.34 | 22.1 | 39.0 | 59.3 |
| Oregon | 7.6 | 10.70% | $68,427.65 | 22.7 | 31.0 | 59.1 |
| Washington | 5.9 | 10.30% | $162,266.30 | 63.5 | 30.5 | 58.3 |
| Illinois | 5.8 | 11.80% | $88,514.81 | 31.7 | 34.0 | 56.6 |
| West Virginia | 7.5 | 9.20% | $59,336.56 | 19.6 | 35.7 | 56.4 |
| Virginia | 6.4 | 10.50% | $73,004.93 | 24.3 | 30.8 | 54.1 |
| Indiana | 7.1 | 14.80% | $49,596.34 | 17.4 | 37.2 | 53.8 |
| Kansas | 6.7 | 10.90% | $53,232.88 | 18.0 | 31.2 | 51.8 |
| DC | 8.6 | 12.10% | $45,654.81 | 14.7 | 42.4 | 51.1 |
| Pennsylvania | 5.6 | 6.00% | $123,730.00 | 43.2 | 19.9 | 50.7 |
| Rhode Island | 3.0 | 16.50% | $171,440.06 | 67.0 | 38.8 | 49.8 |
| Alaska | 6.0 | 15.40% | $46,765.26 | 16.4 | 37.9 | 49.2 |
| Ohio | 6.1 | 13.00% | $47,458.74 | 16.8 | 35.0 | 49.1 |
| Iowa | 6.1 | 11.30% | $50,624.59 | 17.5 | 31.7 | 48.5 |
| Utah | 7.4 | 8.20% | $47,468.10 | 16.7 | 26.5 | 48.4 |
| Nebraska | 7.7 | 9.30% | $43,405.67 | 16.0 | 27.8 | 48.2 |
| Connecticut | 5.7 | 6.30% | $98,380.59 | 33.5 | 23.3 | 47.5 |
| Wisconsin | 5.2 | 13.30% | $48,259.07 | 17.4 | 35.4 | 46.5 |
| Montana | 6.9 | 8.50% | $40,134.19 | 14.4 | 26.9 | 45.8 |
| Wyoming | 12.3 | 5.80% | $42,211.75 | 15.9 | 23.1 | 45.7 |
| New Hampshire | 5.5 | 6.10% | $60,897.46 | 21.5 | 19.4 | 43.6 |
| Idaho | 6.0 | 9.30% | $42,981.16 | 16.1 | 27.8 | 43.4 |
| Massachusetts | 3.8 | 3.50% | $122,606.33 | 46.4 | 19.5 | 43.2 |
| Hawaii | 5.8 | 9.30% | $46,808.64 | 17.4 | 41.9 | 41.9 |
| South Dakota | 7.2 | 7.40% | $41,180.20 | 14.8 | 41.7 | 41.7 |
| Minnesota | 4.6 | 10.80% | $43,482.72 | 16.2 | 14.2 | 40.5 |
| Vermont | 5.3 | 8.80% | $43,485.64 | 15.7 | 38.8 | 38.8 |
| Maine | 4.9 | 4.90% | $41,620.40 | 15.3 | 8.8 | 31.7 |
Methodology
Crash rates
State-level fatal and injury crash data were collected from 2022 state crash reports, or equivalent, where available. Fatal crash data for all states were also obtained from the National Highway Traffic Safety Administration’s Fatality Analysis Reporting System (FARS). National data on injury-causing crashes were sourced from the Crash Report Sampling System (CRSS).
Using the states where both fatal and injury crash data were available, we calculated an average fatal-to-injury crash ratio of approximately 1:44.15. This figure aligned with the national ratio implied by CRSS data. We therefore applied this ratio to FARS fatal-crash figures to estimate the total number of injury-causing crashes in each state for which official state publications could not be found.
For the purposes of this analysis, crashes causing fatal or non-fatal injuries are collectively referred to as “injury-causing crashes.”
Crash risk was normalized by comparing injury-causing crashes to the number of registered drivers in each state.
Tort costs
State-level total motor tort costs were sourced from the U.S. Tort Cost Trends report published by the Institute for Legal Reform (ILR). These totals were used to estimate average tort costs per injury-causing motor crash at the state level.
Extreme verdicts
Data on the largest motor vehicle verdicts and settlements was sourced from TopVerdict from 2019 to 2025. States were assessed based on both the frequency of top verdict appearances relative to crash volume and the typical size of extreme verdicts.
Insurance requirements and underinsurance
Minimum motor insurance requirements by state were sourced from the Insurance Information Institute (III). Each state was assigned a minimum coverage score based on required bodily injury liability limits, uninsured and underinsured motorist coverage, personal injury protection (PIP), and financial responsibility laws.
Uninsured driver rates were sourced from the Insurance Research Group’s analysis of uninsured motorist statistics.
Index construction and weighting
Three component scores were calculated for each state:
- Crash risk score
- Based entirely on the number of injury-causing crashes per 1,000 registered drivers.
- Financial risk score
- 50%: average tort cost per injury-causing crash
- 30%: number of TopVerdict appearances per 1,000 crashes
- 20%: logarithmic mean size of TopVerdict verdicts
- Underinsurance vulnerability score
- minimum insurance requirements score (50%)
- uninsured driver rate (50%)
The final Under-Insurance Risk Index combines these components using the following weights:
- 40% Financial risk
- 30% Crash risk
- 30% Underinsurance vulnerability
Alper Law has structured offshore and domestic asset protection plans since 1991. Schedule a consultation or call (407) 444-0404.